via Java-Applet kann man seine Seite analysieren und grafisch ausgeben lassen. Aharef.info, Websites as graphs:
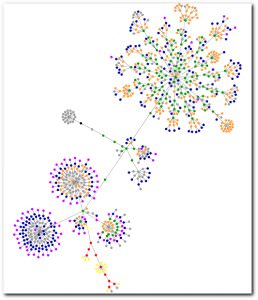
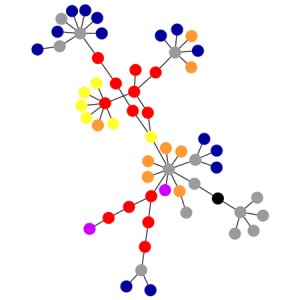
HTML consists of so-called tags, like the A tag for links, IMG tag for images and so on. Since tags are nested in other tags, they are arranged in a hierarchical manner, and that hierarchy can be represented as a graph. I’ve written a little app that visualizes such a graph, and here are some screenshots of websites that I often look at.
I’ve used some color to indicate the most used tags in the following way:
blue: for links (the A tag)
red: for tables (TABLE, TR and TD tags)
green: for the DIV tag
violet: for images (the IMG tag)
yellow: for forms (FORM, INPUT, TEXTAREA, SELECT and OPTION tags)
orange: for linebreaks and blockquotes (BR, P, and BLOCKQUOTE tags)
black: the HTML tag, the root node
gray: all other tags
Basic Thinking Blog
Leider kann man die einzelnen Knotenpunkte nicht anklicken, um weitere Infos zu bekommen. So ist es halt eine nette Spielerei.
Google sieht so aus
via Netzbuch. Ralle kommt seine Blogger-Pflicht nach: Und damit hätten wir dem Web – Spielzeug – Blog – Herdentrieb mal wieder genüge getan. 😉